
業績表現
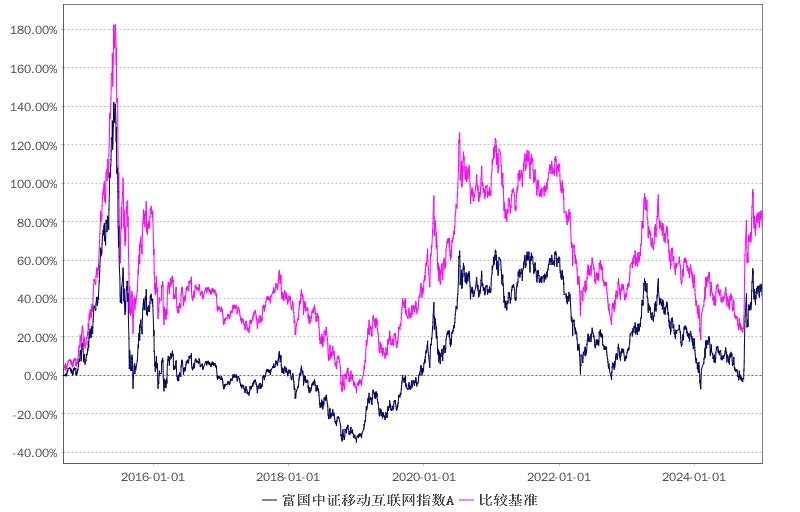
歷年份額凈值增長率與業績比較基準收益率比較表
(2014年09月02日 至 2023年12月31日)
| 時間 | 富國中證移動互聯網指數 | 業績基準 | 戰勝基準 |
|---|---|---|---|
| 生效以來 | 18.97% | 52.17% | -33.20% |
| 2023 | 8.53% | 7.34% | 1.19% |
| 2023 | 8.65% | 7.34% | 1.31% |
| 2022 | -32.40% | -32.49% | 0.09% |
| 2022 | -32.21% | -32.49% | 0.28% |
| 2021 | 7.44% | 3.26% | 4.18% |
| 2020 | 45.84% | 40.59% | 5.25% |
| 2019 | 53.48% | 54.27% | -0.79% |
| 2018 | -33.31% | -32.31% | -1.00% |
| 2017 | 3.09% | 3.88% | -0.79% |
| 2016 | -28.19% | -26.38% | -1.81% |
| 2015 | 28.64% | 56.88% | -28.24% |